2 MIN READ
Published 07/15/2021

From back injuries to broken bones, the top 10 causes of workplace injuries cost U.S. businesses more than $1 billion a week.
Workplace injuries are not limited to high-risk industries such as manufacturing and construction. Disabling injuries can occur on any job, making workplace safety a top concern for employers.
The 2021 Workplace Safety Index (WSI) compiles the 10 causes of the most serious disabling workplace injuries – those that caused employees to miss work for more than five days – and ranks them by direct cost to employers based on medical and lost-wage expenses.

The top 10 causes of disabling workplace injuries
Disabling workplace injuries cost businesses more than $58 billion every year.
The first step in protecting your business and workforce is knowing how serious injuries happen.
Dowload PDF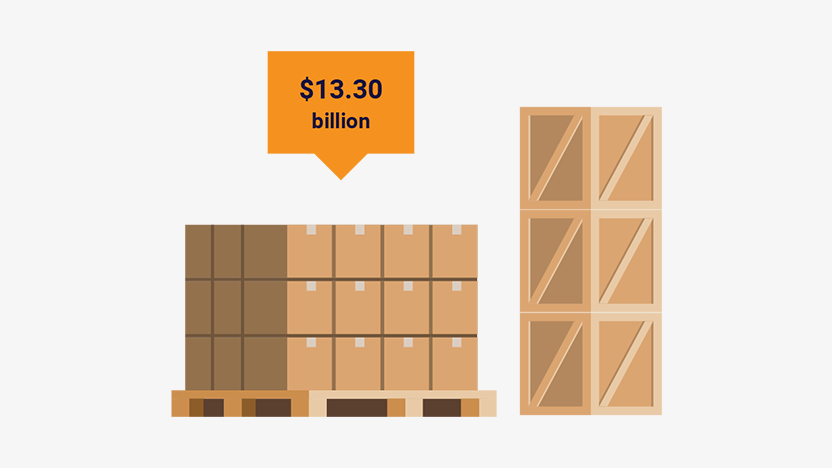
1. Handling objects1
Cost per year: $13.30B
Watch for: heavy boxes

2. Falls on the same level
Cost per year: $10.58B
Watch for: wet floors
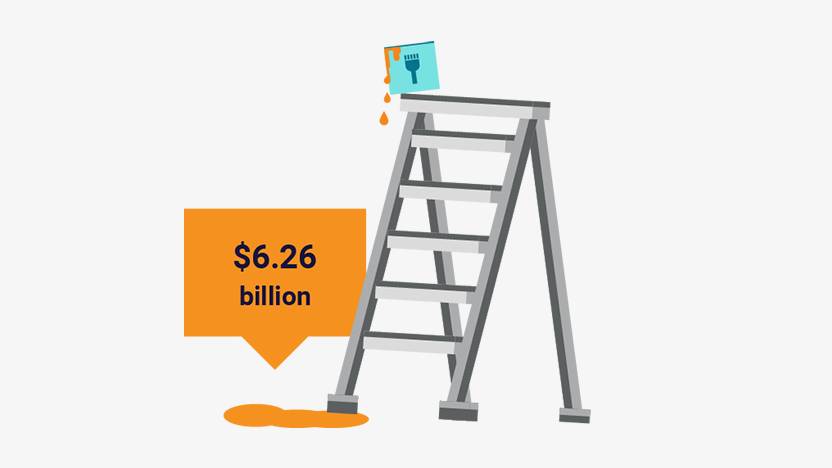
3. Falls to lower level
Cost per year: $6.26B
Watch for: wobbly ladders
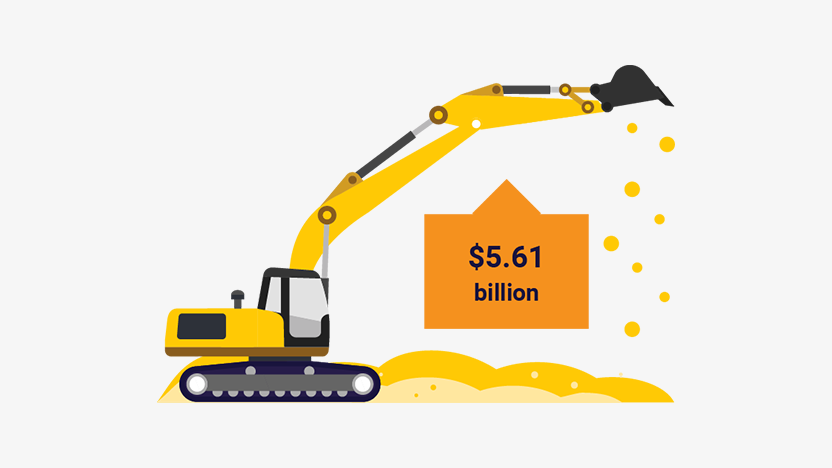
4. Being hit by objects2
Cost per year: $5.61B
Watch for: falling objects

5. Awkward postures3
Cost per year: $4.71B
Watch for: stepping down from a vehicle
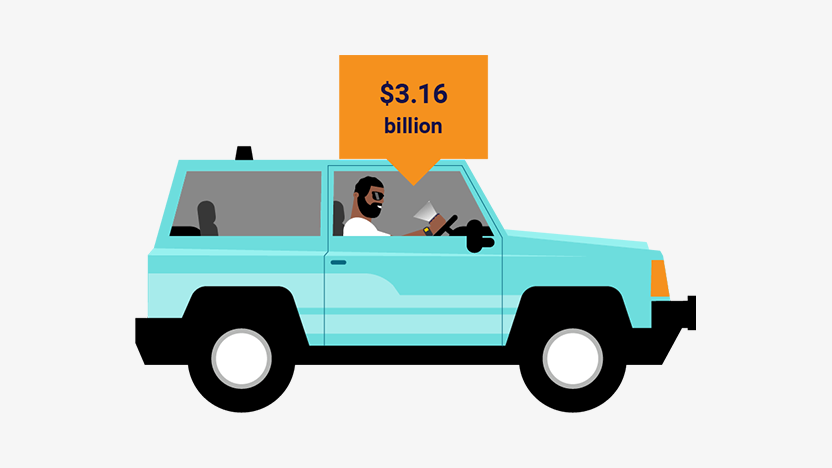
6. Vehicle crashes4
Cost per year: $3.16B
Watch for: distracted drivers
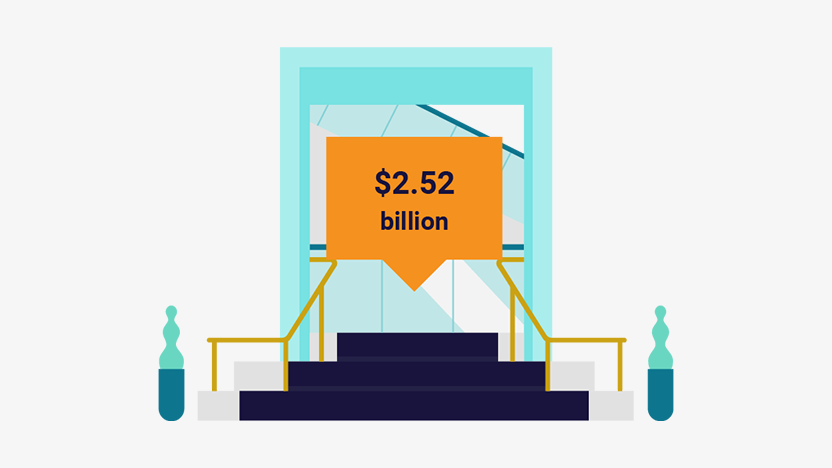
7. Slip or trip without fall
Cost per year: $2.52B
Watch for: slippery or uneven walkways

8. Colliding with objects or equipment5
Cost per year: $2.46B
Watch for: fixed objects in the work or workspace

9. Caught in equipment or machines6
Cost per year: $2.01B
Watch for: moving/rotating machinery parts
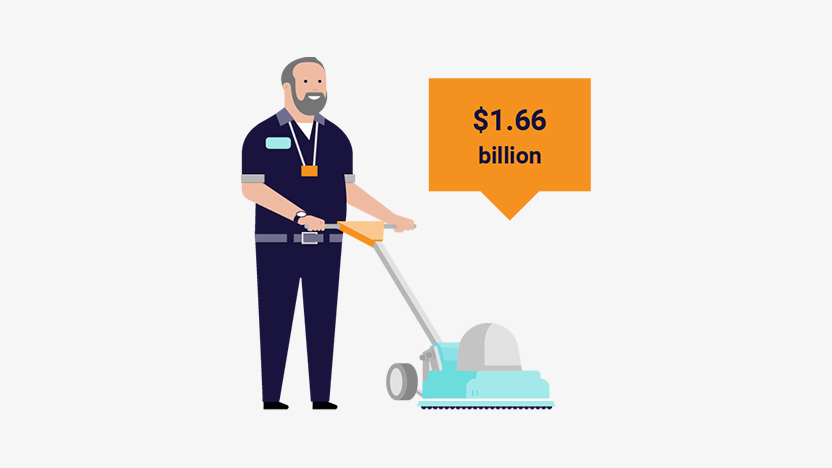
10. Repetitive motions involving microtasks
Cost per year: $1.66B
Watch for: hand- and shoulder-intensive work
Make sure to work with a trusted TPA to examine workplace injuries in your own business, and how you can effectively reduce those risks. Because a safer workplace isn’t just good for employees; it’s good for the bottom line.
Study Methodology:
The annual Workplace Safety Index is based on information from Liberty Mutual Insurance, the U.S. Bureau of Labor Statistics (BLS) and the National Academy of Social Insurance (NASI). BLS non-fatal injury data are analyzed with the Liberty Mutual data to determine which events caused employees to miss more than five days of work, and then to rank those events by workers compensation costs, which are then scaled to the NASI total cost. To capture accurate injury cost data, each index is based on data three years prior. Accordingly, the 2021 index reflects 2018 data.
1. Based on Bureau of Labor Statistics data for “Overexertion involving outside sources” See BLS definitions manual for further detail.
2. Based on Bureau of Labor Statistics data for “Struck by object or equipment” See BLS definitions manual for further detail.
3. Based on Bureau of Labor Statistics data for “Other exertions or bodily reactions” See BLS definitions manual for further detail.
4. Based on Bureau of Labor Statistics data for “Roadway incidents involving motorized land vehicle” See BLS definitions manual for further detail.
5. Based on Bureau of Labor Statistics data for “Struck against object or equipment” See BLS definitions manual for further detail.
6. Based on Bureau of Labor Statistics data for “Caught in or compressed by equipment or objects” See BLS definitions manual for further detail.


Our risk control services are advisory only. We assume no responsibility for: managing or controlling customer safety activities, implementing any recommended corrective measures, or identifying all potential hazards. No attempt has been made to interpret any referenced codes, standards, or regulations. Please refer to the appropriate government authority for interpretation or clarification.
This website is general in nature and is provided as a courtesy to you. Information is accurate to the best of Helmsman Management Services’ knowledge, but companies and individuals should not rely on it to prevent and mitigate all risks as an explanation of coverage or benefits under a policy or service contract. Consult your professional advisor regarding your particular facts and circumstance. By citing external authorities or linking to other websites, Helmsman Management Services is not endorsing them.
