Published 06/11/2020

Explore our infographic to learn more about the ten most common causes of disabling workplace injuries and their costs.
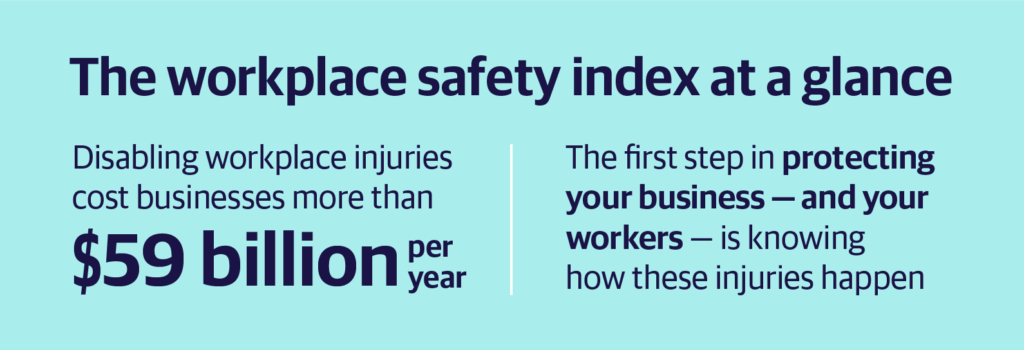
The 2020 Workplace Safety Index (WSI) shows that the total cost of serious workplace injuries has exceeded $59 billion per year, or more than $1 billion per week.
The good news is, the vast majority of workplace injuries could be reduced or prevented through thoughtful, proactive risk control measures. And the first step is understanding how these accidents happen. That’s where Helmsman Management Services can help.
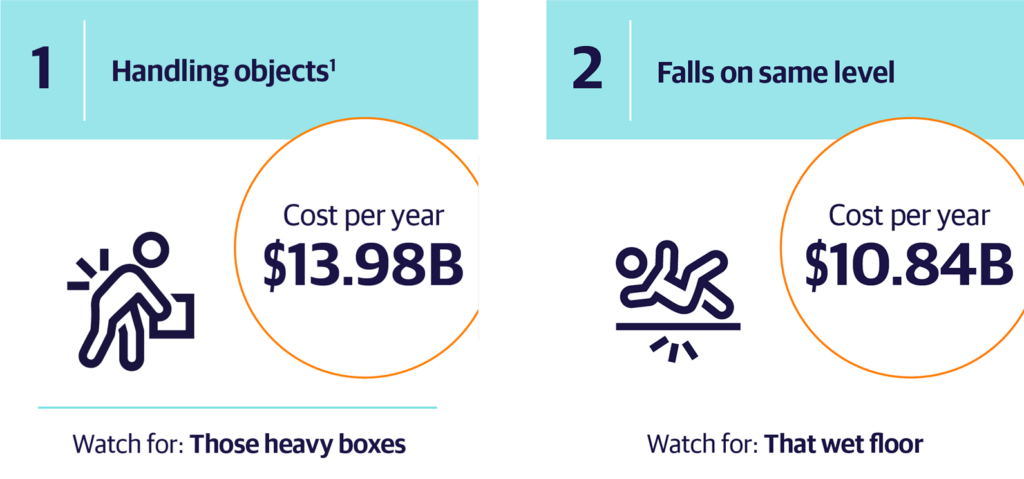
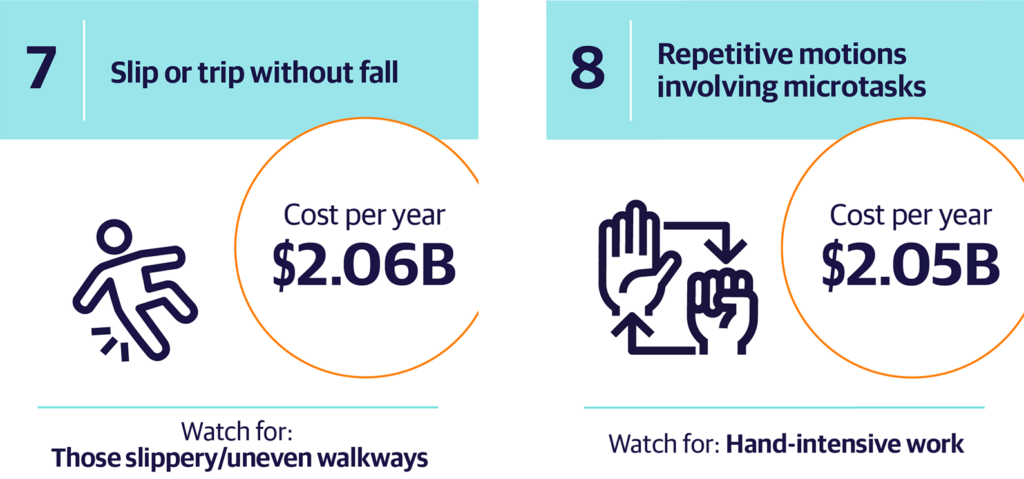
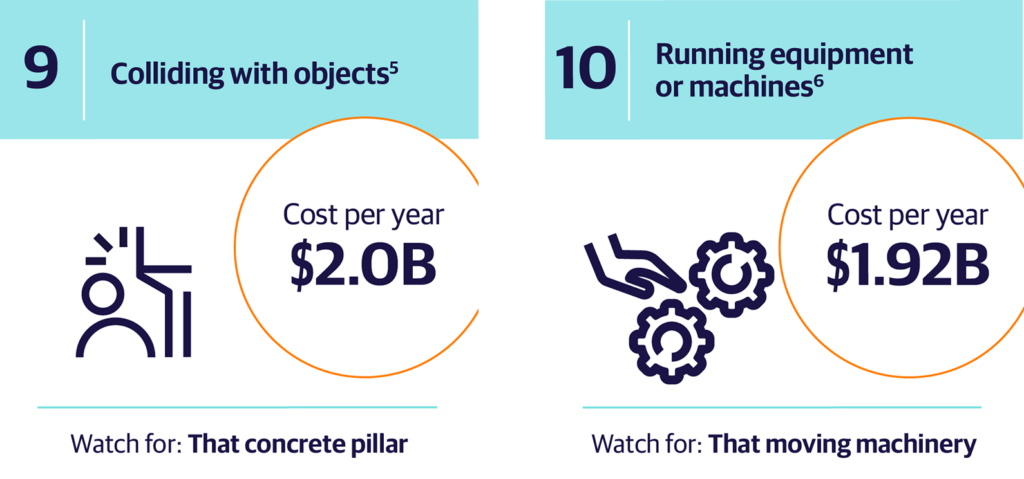
Created from research by Liberty Mutual Insurance, our 2020 WSI identifies the top 10 causes of serious workplace injuries — those that cause employees to miss work for at least five days. In addition, we’ve ranked them according to their direct cost to businesses, based on medical and lost-wage expenses.
Here are the facts:
•$59 billion: total cost of disabling workplace injuries
• $53 billion: total cost of the top 10 disabling workplace injuries
• You can learn to protect your business — and your employees — by understanding how injuries happen.
• Work with experienced professionals to help mitigate these risks.
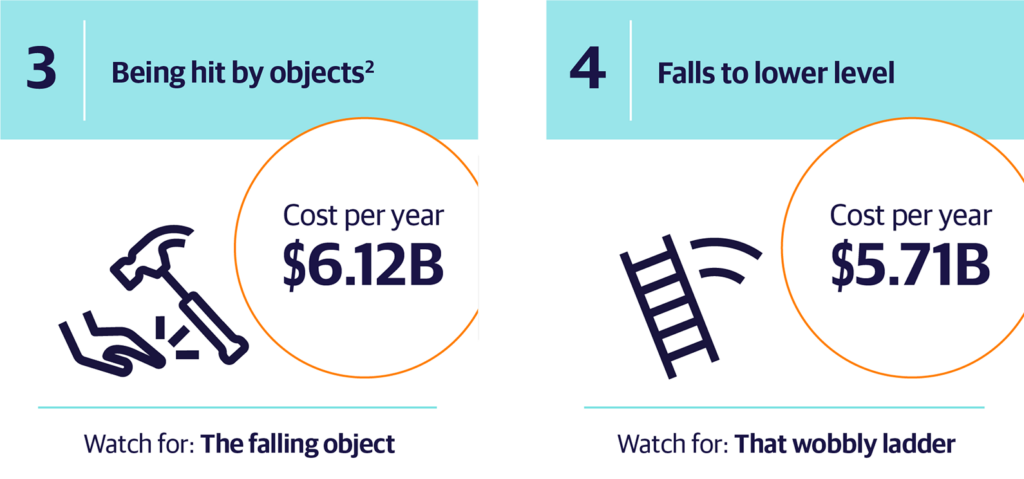
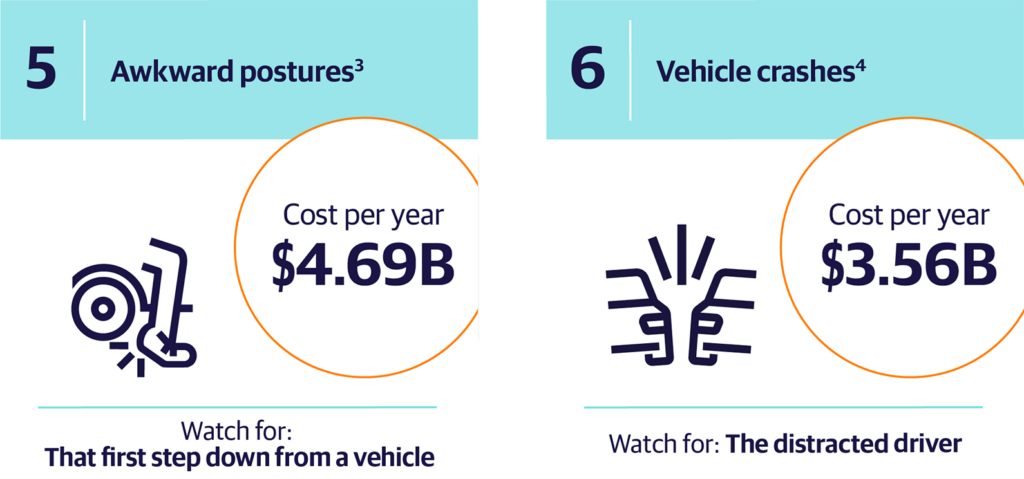
The top 10 causes of disabling workplace injuries:
Make sure to work with a trusted TPA to examine workplace injuries in your own business, and how you can effectively reduce those risks. Because a safer workplace isn’t just good for employees; it’s good for the bottom line.
1. Based on Bureau of Labor Statistics data for “Overexertion involving outside sources” See BLS definitions manual for further detail.
2. Based on Bureau of Labor Statistics data for “Struck by object or equipment” See BLS definitions manual for further detail.
3. Based on Bureau of Labor Statistics data for “Other exertions or bodily reactions” See BLS definitions manual for further detail.
4. Based on Bureau of Labor Statistics data for “Roadway incidents involving motorized land vehicle” See BLS definitions manual for further detail.
5. Based on Bureau of Labor Statistics data for “Struck against object or equipment” See BLS definitions manual for further detail.
6. Based on Bureau of Labor Statistics data for “Caught in or compressed by equipment or objects” See BLS definitions manual for further detail.
Study Methodology:
The annual Workplace Safety Index is based on information from Liberty Mutual Insurance, the U.S. Bureau of Labor Statistics (BLS) and the National Academy of Social Insurance. Liberty Mutual and BLS injury data are analyzed to determine which events caused employees to miss five or more days of work. The index then ranks those events by total workers compensation costs, which include medical and lost-wage payments.
To capture accurate injury cost data, each index is based on data three years prior. Accordingly, the 2020 index reflects 2017 data.
Featured insights


This website is general in nature and is provided as a courtesy to you. Information is accurate to the best of Helmsman Management Services’ knowledge, but companies and individuals should not rely on it to prevent and mitigate all risks as an explanation of coverage or benefits under a policy or service contract. Consult your professional advisor regarding your particular facts and circumstance. By citing external authorities or linking to other websites, Helmsman Management Services is not endorsing them.
Our risk control services are advisory only. We assume no responsibility for: managing or controlling customer safety activities, implementing any recommended corrective measures, or identifying all potential hazards. No attempt has been made to interpret any referenced codes, standards, or regulations. Please refer to the appropriate government authority for interpretation or clarification.
